Learn Japanese Candlestick Charting Techniques for Trading Success
The Candlestick patterns is soul of stock market.All traders in stock market daily read ,analyze and take decision based on candlestick pattern.In this article we can study all the details of Japanese candlestick charting techniques, which is a basic of stock market and with the help of these techniques we can improve your trading strategy.

What is Candlestick in trading?
A candlestick is a type of price chart that displays the high, low, open, and closing prices of the chosen time frame and this technique is used in technical analysis.

As per above image to be consider to know what is bullish and bearish candlestick pattern.
If the close is above the open, we can say that the candlestick is bullish which means that the market is rising in this period of time. Bullish candlesticks are always displayed as white candlestick.
If the close is below the open, we can say that the candlestick is bearish which indicates that the market is falling in this session. Bearish candles are always displayed as black candlesticks.
- The filled part of the candlestick is called the Body.
- The thin lines poking above and below the body are called Shadows or Wick.
- The top of the upper shadow is the High
- The bottom of the lower shadow is the Low.


All Candlestick Patterns
Bullish Reversal Candlestick patterns
- Hammer
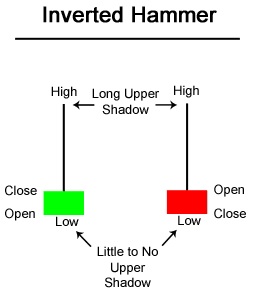
- Inverted Hammer
- Bullish engulfing
- Bullish Harami
- Spinning Bottom
The hammer candlestick occurs when sellers enter the market during down trends. By the time of market close, buyers absorb selling pressure and push the market price near the opening price.
The close can be above or below the opening price, although the close should be near the open for the body of the candlestick to remain small.The colour of the candle does not matter – it could be either red or green.
The lower shadow or wick should be at least two times the height of the body.
Hammer candlesticks indicate a potential price reversal to the upside. The price must start moving up following the hammer; this is called confirmation of bullish reversal.


The bullish engulfing candlestick pattern tells us that the market is no longer under control of sellers, and buyers will take control of the market.
When a bullish engulfing candle forms in the context of an uptrend, it indicates a continuation signal.
When a bullish engulfing candle forms at the end of a downtrend, the reversal is much more powerful as it represents a capitulation bottom.
Bullish engulfing candlestick patterns are more likely to signal reversals when they are preceded by three or more red candlesticks,that means in sharp fall.


Pattern structure A spinning bottom pattern is formed by a single candle, with long wicks extending higher and lower, and a short body.
Ideally, these two wicks should be of similar length, with a short body and a small difference between the opening price and close.
It is important to note that this pattern is much stronger in a trending market, be it uptrend or downtrend.When it takes place in a choppy market, it can be seen as another signal that there is no clarity in the price action.In a strong uptrend or downtrend, the spinning bottom shows there is a new balance of forces in the price action.
As with almost all candlestick patterns, the role of the next candle is important.
In case of a reversal, the candle next to the spinning bottom should be opposite of the prevailing trend, while for continuation patterns, you look for a candle that goes in the same direction to confirm that the price action is continuing in the same direction.

- Hanging Man
- Shooting Star
- Bearish Engulfing
- Bearish Harami
- Spinning Top
The close can be above or below the opening price, although the close should be near the open for the body of the candlestick to remain small.The colour of the candle does not matter – it could be either red or green.
The lower shadow or wick should be at least two times the height of the body.
Hanging man candlesticks indicate a potential price reversal to the downside. The price must start moving down following the Hanging man; this is called confirmation of bearish reversal.


Conclusion
Candlestick patterns are a popular tool used by traders to analyze the price movement of financial assets.There are numerous candlestick patterns, each with its own significance and interpretation. Some common patterns we can see above article include the doji, hammer, engulfing pattern, and harami. Traders use these patterns to identify potential trend reversals or continuations, and use above knowledge their trading decisions.
.png)